Use the font size functions to increase or decrease the font size for all text in the visualization, including legends; the size of the visualization is adjusted accordingly.
Decreasing font size can be useful if you want to fit more items onto the canvas view (for example, if your grid is slightly larger than the canvas), while increasing font size can help make the visual easier to read.
To change the font size, toggle the font size icons (green highlight below) from the Report ribbon.

Examples
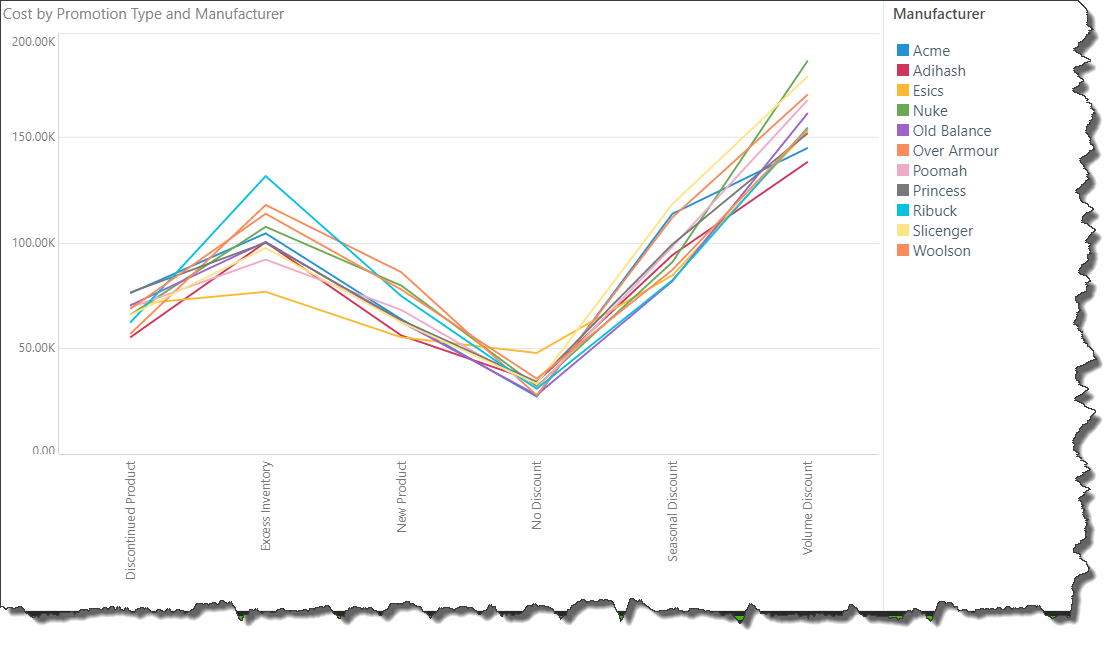
Here, the chart is displayed with the default font size:
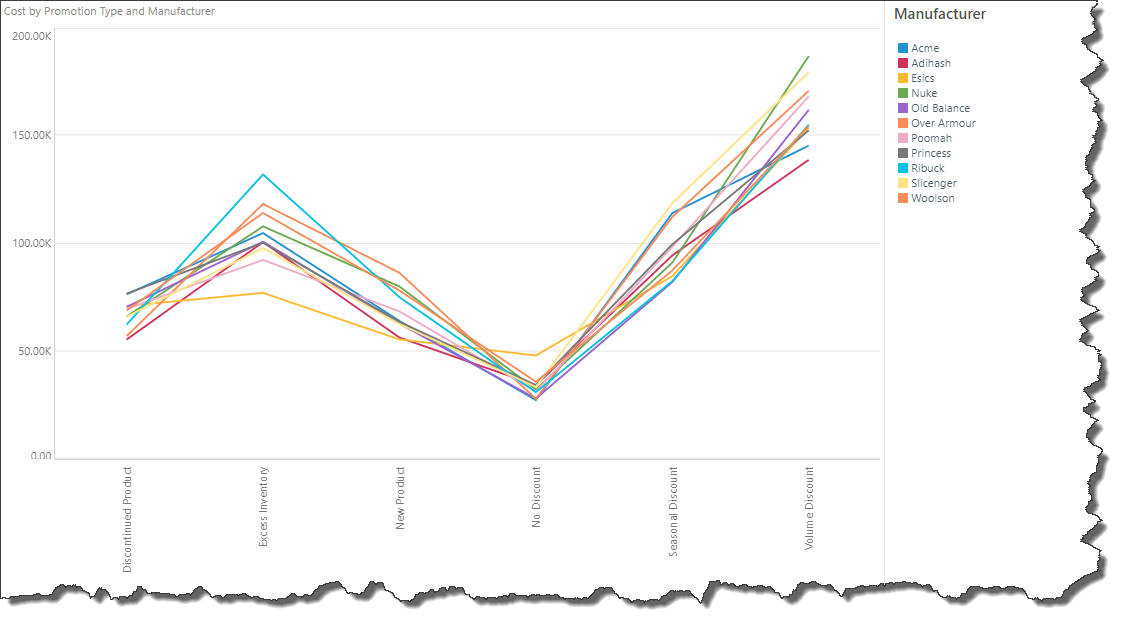
Here, the font size is decreased; this change affects all text in the visual:
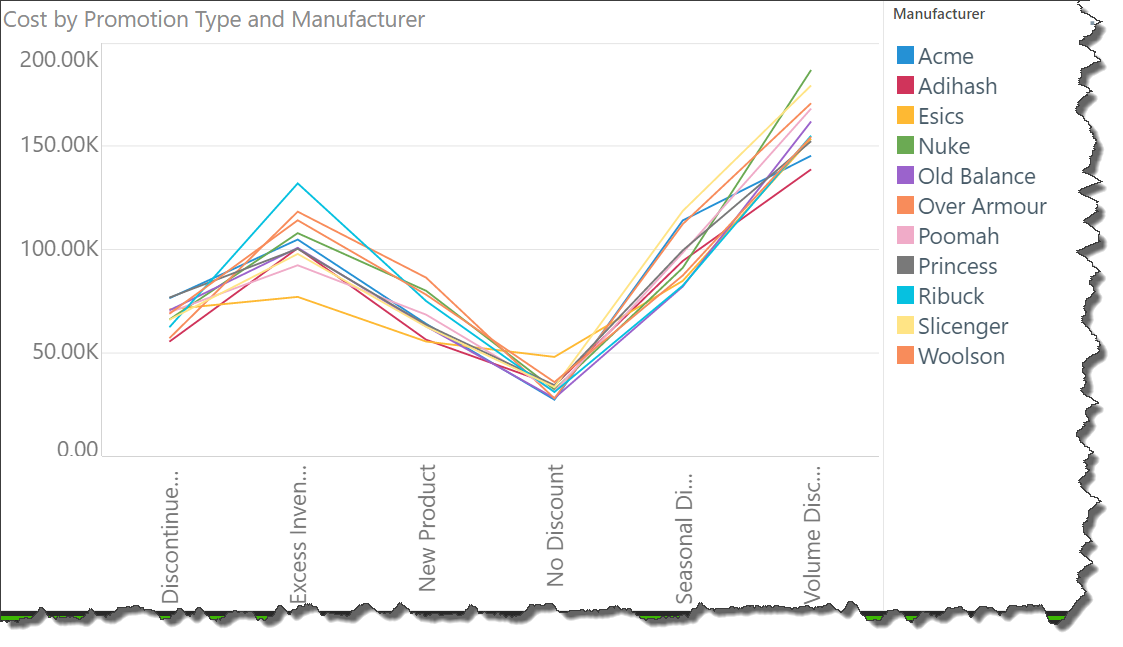
Now the font size is increased; because the visual is a chart, the size of the chart is actually decreased to allow extra space for the larger font:
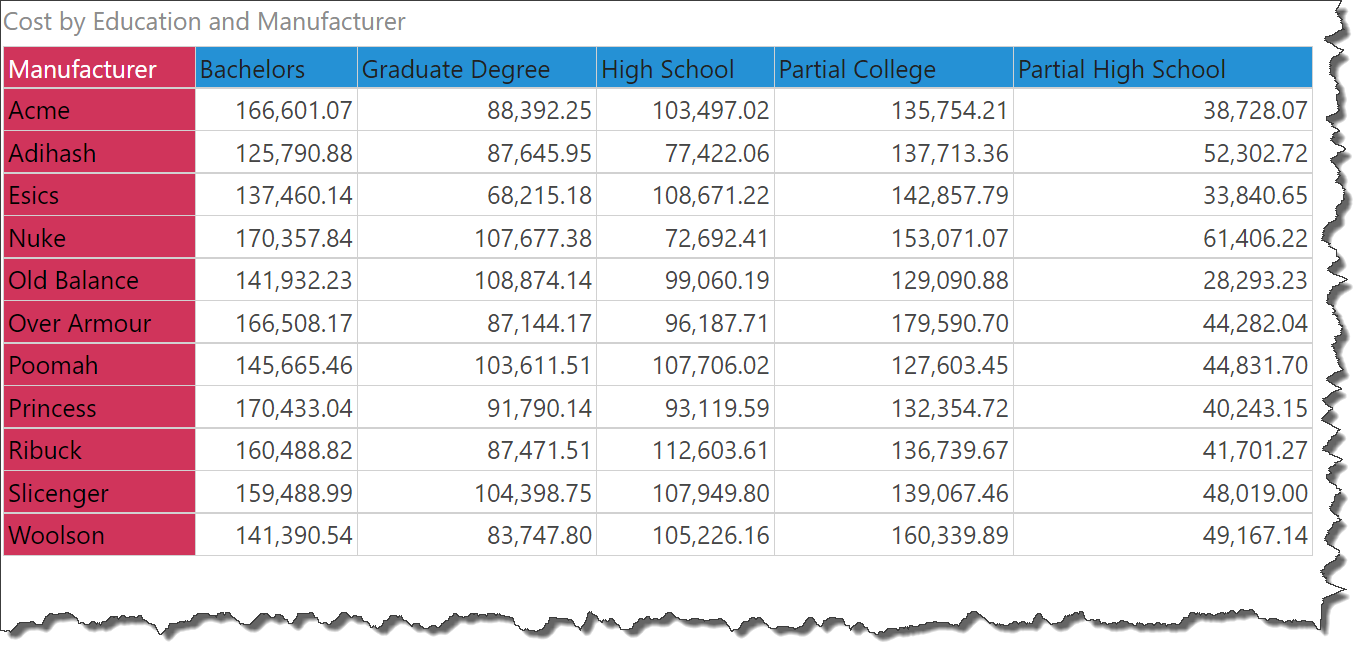
Now the query is visualized as a grid; the increased font size actually increases the grid size, because the text is located inside the visual (as opposed to outside of it, as in the chart above):